
If you are part of the Microsoft Partner Program and you are getting incentive rebates on a monthly basis, most of you are probably like me where you have confusion around where these rebates are coming from on a per customer basis. There also might be confusion around where the money is coming from on program basis as well if you qualify for multiple like Indirect Reseller and Microsoft Commerce Incentives (MCI).
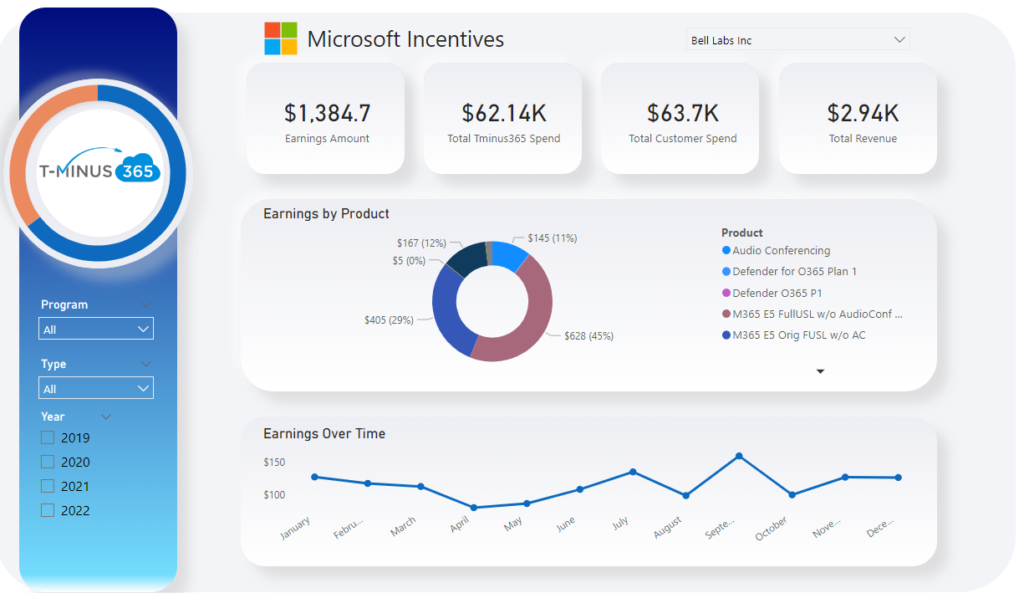
In this article, I will show you how to create a PowerBI report that is taking data from Partner Center so that you can see revenue on a per customer basis.
The report is simplistic in nature but allows you to see:
Required Role:
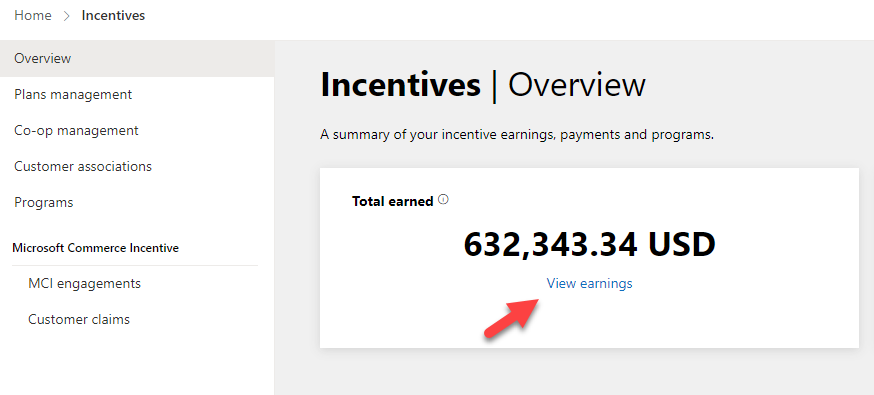
1. In Partner Center, go to the Incentives Page: Partner Center (microsoft.com)
2. Click on View Earnings in the Total Earning box
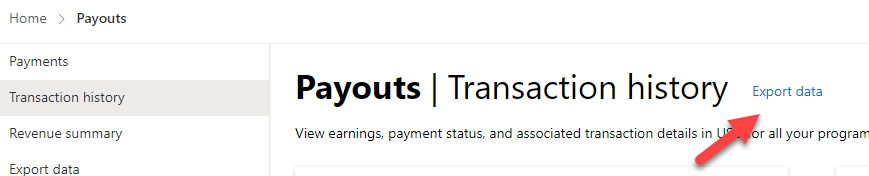
3. Click Export Data at the top of the page
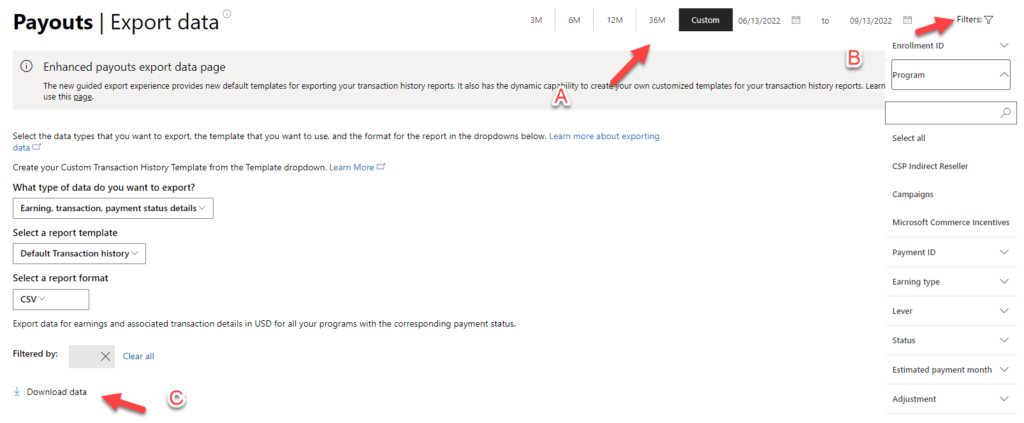
4. On this page, you can perform the following:
A. Filtering date ranges. I typically like to grab all 36 months for the purposes of viewing growth over time.
B. Filtering other metadata. If you wanted to filter other things like the program you can but I like to just grab all of the info
C. When you are ready you can click Download Data
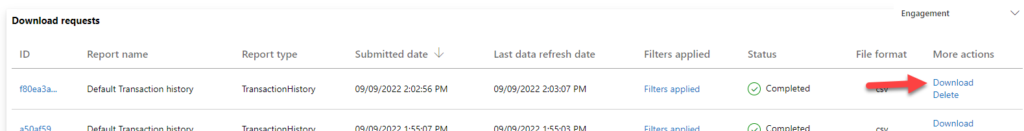
5. This will take a few minutes but when its ready, you can click on Download
The CSV has many columns as you will see. We will only be using a few in PowerBI but I encourage you to explore more here as there are other data points you might be interested in.
When you look through the data, I would specifically check to see if there are any blank values in the programName column. I had many here and was able to decifer what they were by looking at the engagementName column. In my case, I had these blanks coming from Azure breath motion Incentive so I was able to just fill in the blank values with Azure Consumption.
On the CSV, you will also see some negative transaction values. This comes from decrementing seat counts or cancelling subscriptions in a period before earnings were fully realized.
I created the PowerBI report simply using the following columns:
When you upload the excel sheet to PowerBI you can transform the data and remove unncessary columns like participantID for instance. Like I mentioned earlier, I would review more of the info to see if there are other valuable data points for your organization.
For the full tutorial on setting up the BI report, check out my video:
If you have any questions about the report or underlying data, please comment on the video!